The modern web is driven in large part by crowdsourcing. The process is simple enough:
- Find a niche. (no dedicated PG site)
- Stake a claim and create accessible content generation tools. ("PG-HQ" -- records, ratings, & AARs)
- Prime the pump with baseline content. (PG-HQ Library)
- Throw open the doors and welcome in the masses to bring the vision to life.
Such a model lives and dies by the passion of its userbase, but when well-led that userbase becomes a machine capable of accomplishing otherwise impossible feats. One wargamer, or even a team of wargamers, would be pushing up daisies before they'd ever play be able to play 1,300+ Panzer Grenadier scenarios... let alone play them twice or thrice. But we'll get there and then some in a few short years.
The recurring question then from my perspective is how to improve the quality of Panzer Grenadier Headquarters? Answering that question is easy enough, but sifting through those answers to find the initiative(s) that create the most benefit for the most people is a fair bit trickier. Would it be an improvement to have image support in our AARs? Absolutely. Do most wargamers take pictures while they play? A quick survey of CSW and BGG tells us absolutely not. Am I implying that PG-HQ will never add image support? Of course not. But it is a useful example.
So what fits? How do we uniformly increase the quality of our site for (almost) everyone at the same time?
...by playing EVERYTHING.
Upward, ever upward
From birth we've had the PG-HQ database play coverage and AAR coverage stats listed on the front page. They've slowly ticked upwards, too slowly - at least for me. When I was running the stats for the Road to 1,000 article I estimated the times when we'd reach 100% play and 100% AAR coverage by projecting the average rates of increase from the last few months. The results were not particularly inspiring:
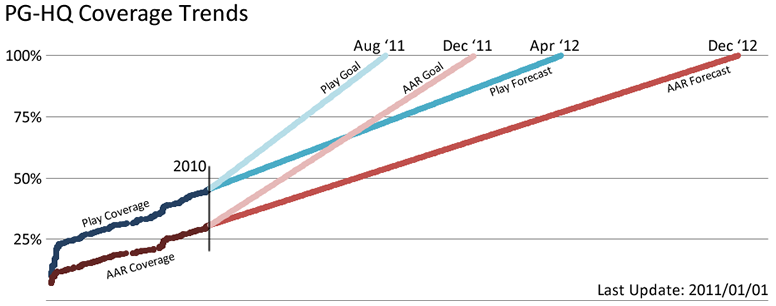
...it would be a year and a half until we reached 100% play coverage, and nearly 2 full years until we had an AAR for every scenario. I should add that this was an extremely conservative projection based on the assumption that no new scenarios would ever be released, a situation that's clearly false.
Waiting two years (or more) to reach 100% AAR coverage isn't a terrible thing, but I began to wonder if there was a way to speed the process up a bit. Now none of you are paid to play, and everyone has their own area of interest, but if one could devise a way to steer players away from recording the 73rd play of Airborne #1: Orange Hero and nudge them to try something which no one else has yet played... well, there's value in that, right? And so, after deliberation, consultation, and a judicious amount of inebriation, the PG-HQ Bounty Hunting System was born.
The Quarry
It is not enough simply to beg you all to go play unplayed scenarios. There is nothing particularly compelling in such a plea. Since we all, as our very presence indicates, enjoy a good game - why not make a game of completing our play coverage? Thus, each and every scenario in the library has been assigned bounty values in the form of Play Bounty and AAR Bounty point values. Simply put, if you record a play for that scenario you are awarded that many points, and if you include an AAR you receive those points as well.
What are these bounty points worth? Nothing, really, other than bragging rights. Members with high bounty totals play a lot of unplayed scenarios, play small amounts of unplayed monster scenarios, or in rare cases play lots of unplayed, monster scenarios! In short, your bounty score is tells us how much you're helping to drive PG-HQ forwards.
Scenario Value
Not all scenarios are created equal and the bounty system has been designed to take that carefully into account. AAR Bounties are simple to calculate - the more AARs a scenario has, the less each subsequent AAR for that scenario is worth. Play Bounties, however, are rather complex. They are composed of five factors grouped into two themes: Difficulty of Play (# of turns, # of counters, map footprint) and Rarity (# of owners, # of existing plays). Every 48 hours play and AAR bounties are recalculated and updated for every scenario in the database. Details and recent distributions for each factor are explained below.
Note - all of the following data were taken from an early-January database snapshot. Several factors have changed a bit since then, but the principles of calculation have not.
AAR Bounties
Calculated as a straight rarity rating, first we establish the current maximum AAR count for any scenario in the database - in early January this was the 10 AARs filed for our old friend Airborne #1: Orange Hero.
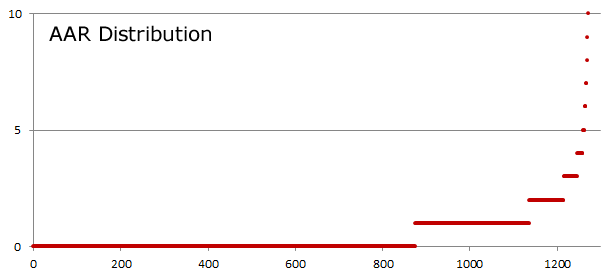
As you can see above, the vast majority of scenarios have no AAR, though a not insignificant amount already have at least one. Scenarios with 5+ AARs are exceedingly rare at this time. To calculate the AAR bounty values we basically invert that distribution and map it to a 200 point scale. The end result looks something like this:
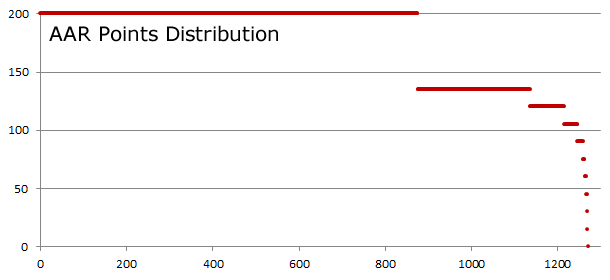
Any scenario lacking AARs is worth 200 bounty points, and the bounty value declines by equal measures as AARs for that scenario become more numerous... except you may have noticed the first drop - from 0 to 1 AARs - is especially steep. The AAR Bounty for a scenario with 1 AAR is 140 points, fully 60 points less than that with no AARs. This massive drop in value after submission of only 1 AAR is to encourage players to snag that first bounty. Clearly, to PG-HQ going from 0 AARs for a scenario to 1 is far more valuable than going from 1 to 2. Play Bounties have a similarly steep built-in initial drop to encourage the "early birds".
Now that you understand the basic bounty calculation method, we can more or less breeze through the 5 factors used for calculating Play Bounties.
Play Bounties - Rarity Group - Existing Plays
Play Rarity is split into two sub-factors, the first of which is existing plays. The bounty point calculation method is identical to that of AARs. First the site looks at the current distribution of plays for all scenarios:
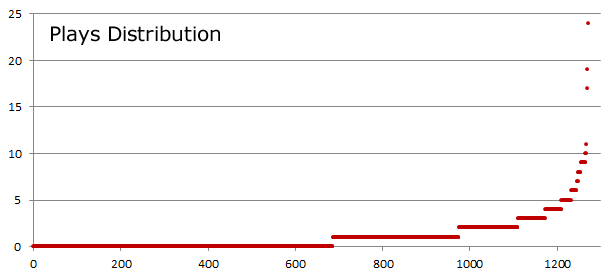
Then point values are inversely distributed on a 100-point scale, such that scenarios with no plays are worth the most, and the higher the existing playcount for a given scenario the lower this sub-factor is worth. Note also the 50 point drop for the early bird who records the first play for this scenario.

Play Bounties - Rarity Group - Ownership
The second sub-factor for calculating rarity is ownership. If a scenario is owned by lots of members it is more likely to be played than one owned by very few. In the chart below the y-axis is total members owning that scenario. The line of scenarios most owned all come from Eastern Front, of course, which is to be found on the shelves of over 160 gamers around the world.
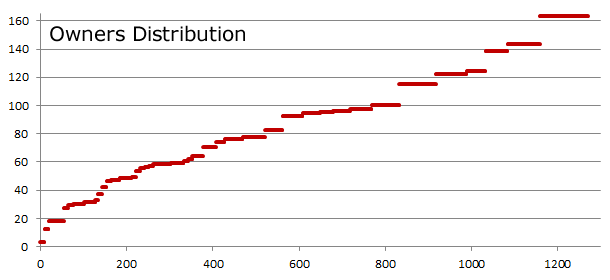
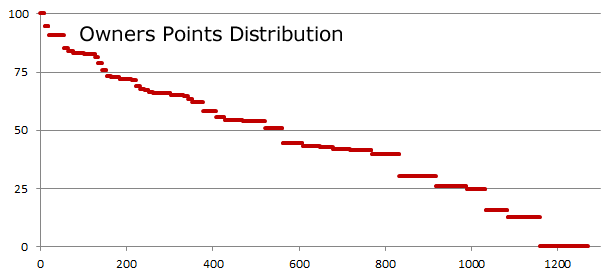
In order to assign point values, we give the most points to scenarios owned by the fewest people, to encourage owners of obscure scenarios to play and record them for the benefit of all.
Play Bounties - Difficulty Group - Turns
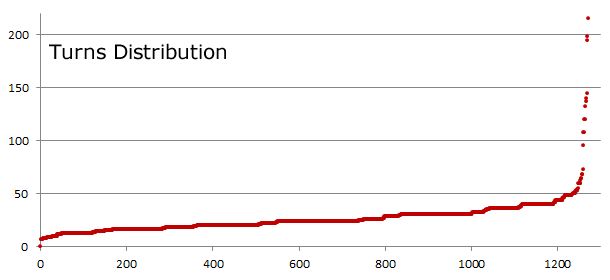
The first sub-factor for calculating difficulty of play is scenario length, i.e. turn count. In keeping with the process outlined above, first the site looks at the global turn distributions...
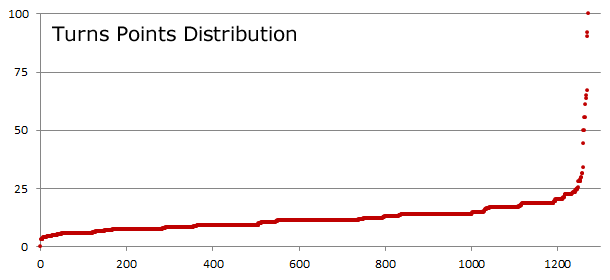
And then maps to a 100 point scale such that the more turns a scenario has the more points it receives.
Play Bounties - Difficulty Group - Footprint
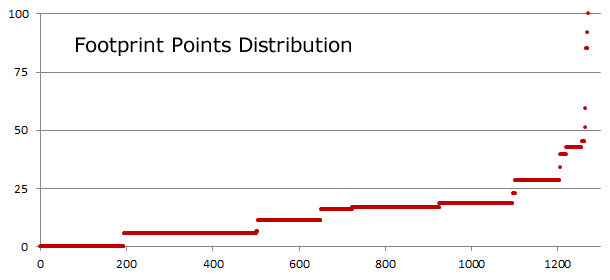
Footprint, literally how much area the map layout takes on your table in square centimeters, is also a factor in difficulty of play. It's much easier to toss down a one-map scenario than it is to get all four Cassino maps out and in play.
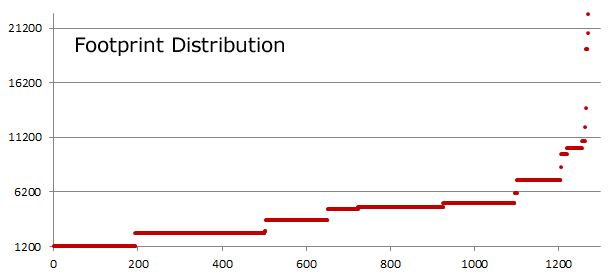
You'll see that most scenarios score quite poorly in this sub-factor. Considering how rarely monster PG scenarios get played, this sub-factor is appropriately rewarding I think.
Play Bounties - Difficulty Group - Counters
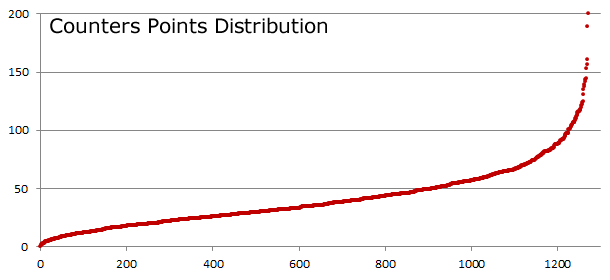
The last sub-factor to mention is counter totals. Panzer Grenadier actually has a fairly smooth counter distribution, as the graph below shows.
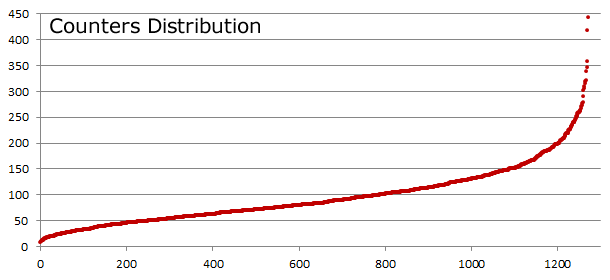
Worth mentioning here is that the counter sub-factor values map to a 200 point scale rather than 100. This is due to my belief that finding, setting up, moving, and packing away large numbers of counters is a far greater time sink (read: difficulty) than high turn counts, and that therefore this indicator should get the most weight.
Play Bounties - Overall Composite
Having briefly discussed each of the 5 play bounty sub-factors, it's time to toss them all together and see what the final result looks like:
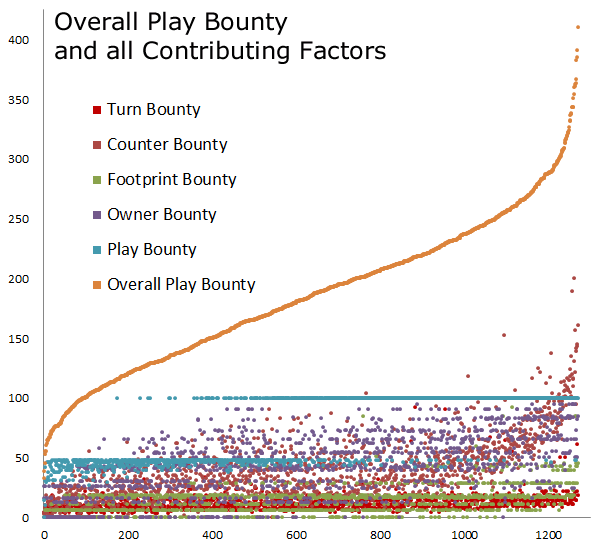
Thankfully, it turns out to be a beautiful S-curve and a well-balanced distribution from top to bottom. The least valuable play bounties are about one-tenth of the value of the most coveted, and if you think of it in terms of plays -- 10 plays of a short Airborne scenario versus 1 play of a monster Blue Division slugfest -- everything seems pretty well sorted!
Real Examples
But so far we've been discussing faceless scenarios - so how about we look at 2 examples? In early January the "cheapest" bounty was for Airborne #1 and the highest was for Grossdeutschland 1946 #3:
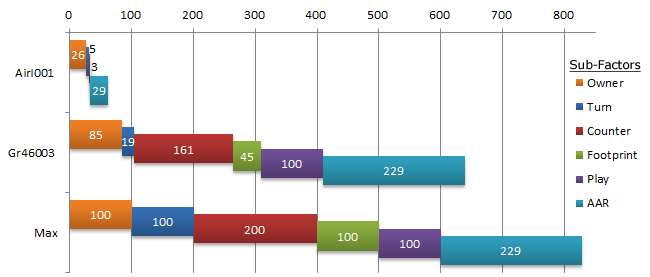
The maximum possible bounty at that time was a little over 800 total points, assuming you both recorded a play and wrote an AAR. With only 639 points, Gr46 #3 falls well short of that. We can see that it earns relatively few points for its turn count (40) and footprint (4x2) while pulling down major points for its low ownership, high counter total (357), and of course for being unplayed.
Overall Bounty Distribution
Finally, when you toss the play and AAR bounties together to get the overall value for a scenario, the numbers shake out like so:
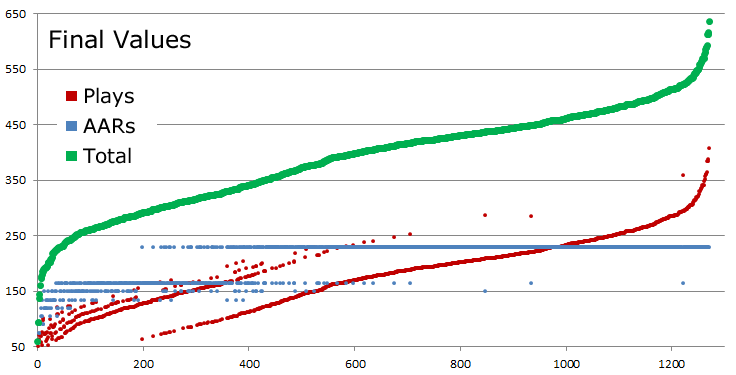
We still have that gentle S-curve, and a nice consistent points distribution right across the board.
How it works for you
The bounty system went live on January 1st 2011. Any records and AARs, including new AARs for existing records, automatically earn bounties. By adding a new play or AAR you "claim" the current bounty for that scenario. The site automatically recalculates the bounty values for each and every scenario at 48 hour intervals. The PG-HQ's Most Wanted page lists our all-time and recently hot "bounty hunters", as well as the most valuable bounties available both globally and within your own collection. The Home Tab of My PG-HQ includes your personal total bounty score, and will list your global rank in the near future.
Concluding Thoughts
At the end of the day, the purpose of the bounty system is to gently prod our active players towards fleshing out our records. It also does double-duty as an informal Grognard Rating, since the difficulty of play comprises over half of the bounty value. Participation, as it stands, is automatic - you'll be awarded bounties with every play and AAR. Caring, however, is voluntary. Though I do hope you will! :-)
